
This gallery contains 1 photo.
Tableau viz showing rates of non-medical vaccine exemptions of kindergarten kids by zip code. Continue reading

This gallery contains 1 photo.
Tableau viz showing rates of non-medical vaccine exemptions of kindergarten kids by zip code. Continue reading

This gallery contains 1 photo.
Univariate, bivariate and multivariate analyses and visualizations using R Studio. Continue reading
I used Python to clean and aggregate data and then created some basic data visualizations in Tableau to look at which state characteristics appear to have an effect on the number of background checks for firearms purchases.
There are definitely some interesting patterns. The HTML files with all the details are in the links below, however here are some highlights:
More and more NICS checks are being done every year:

Cyclical nature of NICS checks, but overall increasing since 1998:

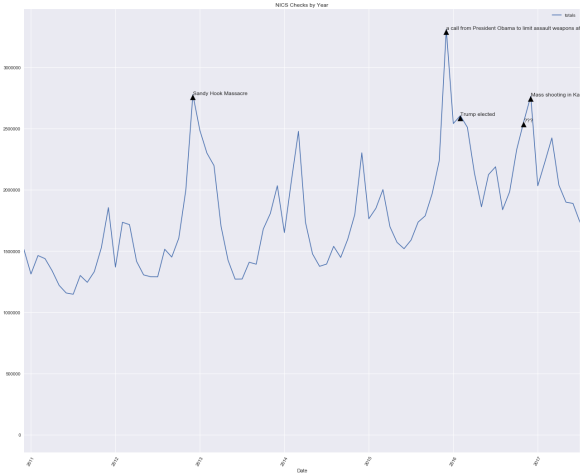
Number of checks with key events:
State by State:

Are you wondering what’s with Kentucky? It’s not as scary as it looks – new legislation was passed that makes certain permit holders required to do an annual background check, so in this case, checks aren’t a great proxy for purhcase rates.
Here’s another state-by-state, this time the graph colored by voting tendency:

Please check out the full analysis! Links below:
More Info: Evernote Airtable Google Drive GitHub
I am an insomniac.

me. a lot.
I’ve been wearing a Fitbit for more than 5 years. I took over a year of my own Fitbit sleep logs and created a Tableau Story Point to explore patterns and see if they hold any useful info! I explored activity levels (total active minutes, etc.), menstrual cycle phase and calorie burn.
I used Tableau Story Point to walk through the exploration: Check it out here.
More Info: Airtable GitHub Tableau Public
The brilliant folks at CBInsights are keeping a running list of failed startups and their view of what happened to each. I scraped, cleaned and analyzed the text of 100-odd start-ups on the list to see what we can learn. Here is the infographic:

The Tableau Workbook can be found here.
I can send you the data as well – contact me.
